Heliotrope
One sun, two worlds, the same moment. A browser-based instrument that renders the same moment on Earth and Mars, side by side, and the sunlight that falls on each. Pick a station — equator, tropic, or pole — and any moment across 2026, and both scenes update in lockstep from a single time source: the same sun, but shorter shadows on Mars, dustier light, and the Mars sol quietly running ~39 minutes past the Earth day. Same instant, same star, but the light lands differently on each.
How it works — The sun's position on each world is computed from published astronomical algorithms — a standard solar-position model for Earth, and NASA's Mars24 algorithm for Mars — sampled every 10 minutes across the whole year. Those figures are cross-checked against NASA JPL's ephemeris data, agreeing to within a hundredth of a degree, and a verification suite runs a set of landmark checks (equinoxes, solstices, year-end wrap) before every deploy — so the way the light falls reflects the sun's real position relative to each planet. The scenes themselves are built in Three.js, both driven from one shared time source, with shadows and sky palettes tuned to each planet: sharper, dimmer sun on Mars, softer and brighter on Earth.
Heliotrope continues a conceptual thread that began with Meridian, an earlier installation that mapped the length of twilight across six cities on a single line of longitude — the same fascination with how one sun, one moment, reads so differently from place to place. Here the line just runs a little further, to Mars. The sun positions are real, pulled from NASA/JPL data, but this is an art experiment, not a scientific simulation.
Built with Claude (Jun 2026).
Live: LINK
Today's Angle
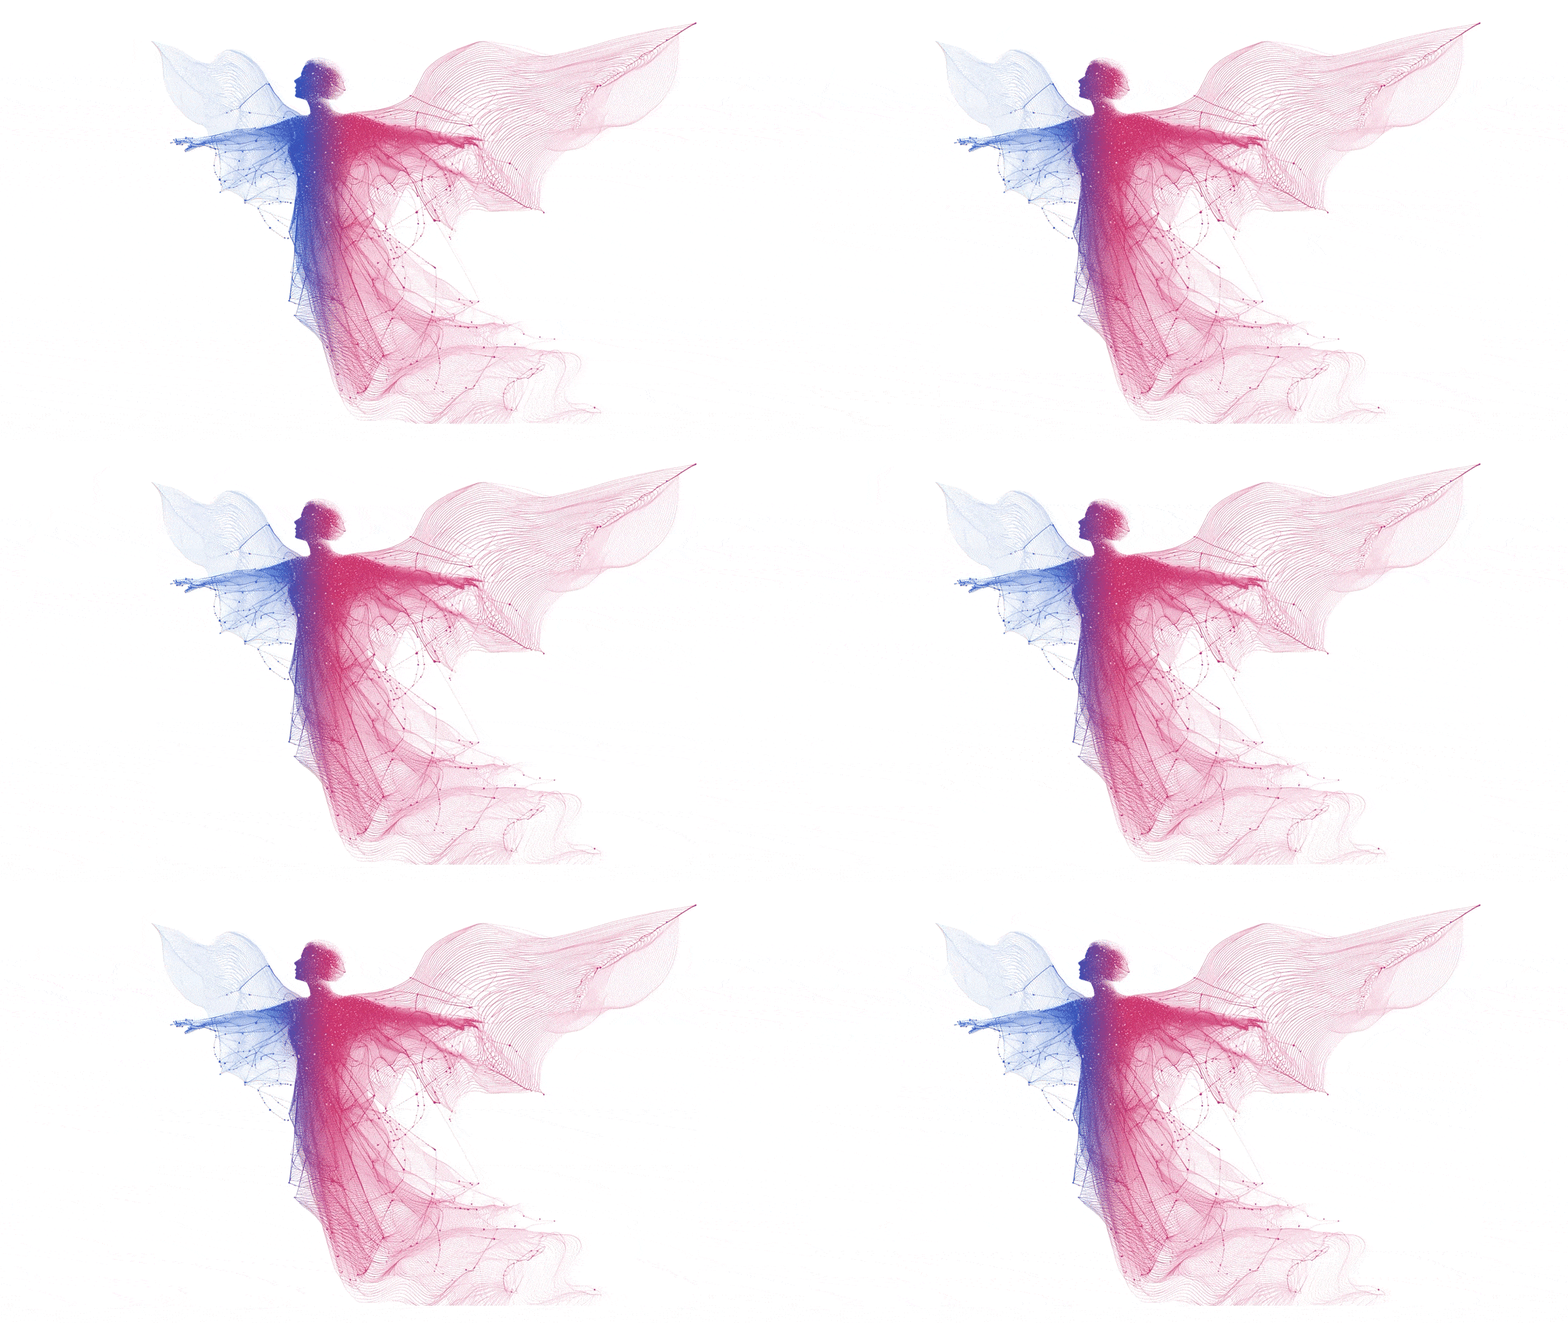
A live visualization that reads the mood of the news in colour. A line-art angel drifts between blue and pink — blue where the world is kind, pink where it grieves — driven by sentiment analysis of headlines from three international news outlets. The boundary between the two colours moves slowly, breathing across the figure over minutes, so what you see is the weather of the news, not any single story.
How it works — A Python service pulls RSS headlines from BBC World News, The Guardian, and Al Jazeera every few minutes, scores each one through VADER sentiment analysis (−1 grim to +1 kind), and averages them into a single "good-news proportion." That one number drives everything: a WebGL shader tints the grayscale angel live, blending blue to pink across a soft band so the hues glow into each other. The boundary eases toward each new reading over about a minute — slow enough that one grim headline can't yank it around — with a subtle three-sine wobble giving the figure a breathing motion, alive even when the news is static.
Built with Claude Code (May 2026).
Healthy London
An interactive look at healthy life expectancy across London's five NHS Integrated Care Boards (ICBs). The question it asks: people here are living longer, but how many of those years are spent in good health? Built on Office for National Statistics data (2022–2024), an SVG map of London's five ICB regions lets you toggle by sex, age (at birth or at 65), and metric — healthy life expectancy, or the gap between it and life expectancy — with per-region insights and a set of infographic slides.
How it works — Everything is built around a single map of London, split into its five ICB regions, that recolors as you change the filters. Green shows life expectancy, coral shows the gap in years spent in poor health, and the shade of each region tracks its actual value. The map holds a steady color scale as you switch between male and female, so any change you see is a real difference between the two — not the chart rescaling itself.
Some of the insights surfaced in the map were worked up into a series of infographics. A methodology section sets out how the data was sourced, handled, and turned into the comparisons on show.
Built with Claude Code (May 2026).
Live: LINK
FORMFLOW - Procedural 3D Point Cloud Generator
A browser-based tool that turns any image or video into a real-time 3D point cloud. Inspired by TouchDesigner, but built to skip the setup: what would normally mean wiring up texture operators (TOPs), geometry, and custom GLSL shaders becomes a drag-and-drop canvas. It reads pixel brightness to infer depth — no LiDAR or depth camera needed — then layers 3D Simplex noise on the GPU to animate static media into shifting digital terrain. Live controls for noise (frequency, amplitude, speed) and look (resolution, point size, brightness cutoff, palette, opacity), all reacting at 60fps. Export stills as PNGs or record the animation as WebM, straight from the browser.
Built with Google AI Studio (Apr 2026).
Live: LINK
EchoVision
A remix of an OpenCV object-tracking app, reworked to answer a question: could what a camera sees be turned into sound? The result is a split-screen: ordinary human vision on the left, a simulated bat's-eye view on the right, both running off the same tracking engine. The left side keeps the original video feed with real-time optical-flow tracking and labels. The right side replaces the labels with echolocation: Gemini estimates the relative depth of each object, then that spatial data is mapped to sound with Tone.js — an object's horizontal position sets the stereo left-right, and closer objects trigger higher, faster sonar clicks while distant ones pulse low and slow. Pulsing green beacons stand in for the labels, their speed tracking proximity. Ordinary video has no depth data, so the distance is AI-guessed — a synthetic sense of space stitched onto a flat image.
Built with Google AI Studio (Apr 2026).
Live (requires Google sign-in): LINK
Generative Art App
A browser-based sandbox that turns a text prompt into live generative art — no Processing or p5.js coding required. It automates the creative-coding step: you describe what you want, Gemini writes the p5.js sketch on the fly, and it renders instantly on the canvas. Comes with preset styles to explore (flowing Perlin-noise fields, cellular automata, recursive fractal trees), and you can capture stills as high-res PNGs or record the animation as video straight from the browser. Each run is a little different, so it's built for iterating — generate, adjust, generate again.
Built with Google AI Studio (Mar 2026).
Live: LINK